1. Framework & Numbered Panel Examples (1-5)
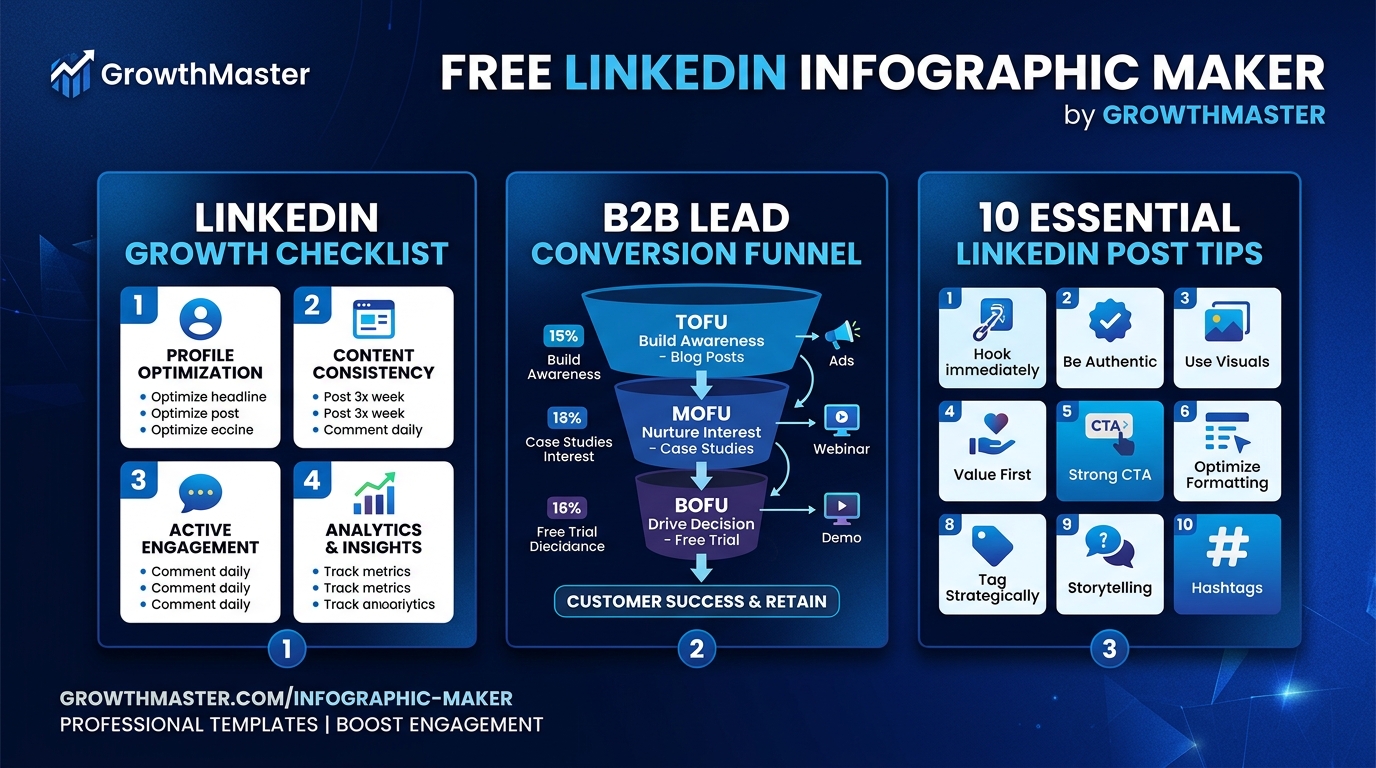
Numbered panels are the most versatile infographic on LinkedIn. Dividing your graphic into 4 balanced boxes lets you explain any multi-step system clearly:
- **Example 1: The B2B Sales Playbook:** 4 cards outlining Prospecting, Warm Discovery, Offer Demo, and Contract Close.
- **Example 2: The Cold Outreach Matrix:** 4 cards separating Warm Leads, Inbound Comments, Cold ICP, and Dream Accounts.
- **Example 3: The 4-Hour Workday Setup:** Morning deep work, afternoon reviews, asynchronous communications, and evening wind-down.
- **Example 4: 4 Rules of Viral Copy:** The Hook, The Rehook, The Proof, The Ask.
- **Example 5: The Tech Stack Teardown:** CRM, Lead Enricher, Post Scheduler, and Analytics Dashboard.
Free Tool
Explore Infographic Templates Turn Any Topic Into an Infographic in 30 Seconds
Choose from 44 LinkedIn templates in the free GrowthMaster Infographic Maker. Change text, apply custom brand colors, and export sharp 4:5 images instantly.
2. Sales & Marketing Funnel Examples (6-10)
Funnels visually represent transformation over time. Top creators use funnel infographics to demonstrate how passive audience members turn into high-ticket clients:
- **Example 6: Stranger to Retainer Funnel:** Views post -> Visits profile -> Subscribes to newsletter -> DMs questions -> Signs retainer.
- **Example 7: The B2B SaaS Pipeline:** Top of funnel educational carousels down to free trial onboarding and annual contract expansion.
- **Example 8: Employee Advocacy Funnel:** Executive alignment down to daily engagement prompts and brand advocate rewards.
- **Example 9: Lead Magnet Conversion Flow:** Viral post hook down to auto-DM comments, landing page opt-in, and 7-day email sequence.
- **Example 10: Event Registration Funnel:** Announcement post to speaker highlights, attendee Q&A, and post-event replay bookings.
3. High-Density Cheat Sheet Examples (11-15)
Cheat sheets generate the highest volume of bookmarks and profile saves on LinkedIn. The key is packing 8-10 concise, high-value lines into a single page:
- **Example 11: 9 LinkedIn Hooks That Never Fail:** Contrarian, Question, Numbered List, Secret Teardown, Before/After, and Mistake Callout.
- **Example 12: 10 AI Prompts for Post Generation:** Exact prompt templates paired with intended output formats.
- **Example 13: The Pre-Post Publishing Checklist:** 5-second hook audit, line spacing check, mobile font verification, and engagement warmup.
- **Example 14: 10 Corporate Buzzwords to Cut:** Buzzwords paired directly with natural, high-trust replacements.
- **Example 15: The Creator Directory:** 15 accounts categorized by discipline that founders should follow this year.
4. Growth Curves & Data Metrics (16-20)
Charts that tell a story perform dramatically better than dry corporate spreadsheet screenshots:
- **Example 16: The 365-Day Growth Curve:** A steep curve showing 4 months of plateau followed by hockey-stick reach once consistency was locked in.
- **Example 17: The 4-Metric Year in Review:** Impressions, Client Calls, Inbound Pipeline, and Follower Count in big, bold typography.
- **Example 18: Time Invested vs Reach Generated:** Contrasting manual copy-pasting vs structured content sprint workflows.
- **Example 19: The Content Decay Curve:** Showing how high-save infographics continue generating impressions for 5-7 days post-publish.
- **Example 20: Post Frequency vs Follower Growth:** Analyzing the engagement delta between posting 2x/week vs 5x/week.
5. Comparison & Venn Diagrams (21-25)
Side-by-side contrast creates instant tension that makes readers pause:
- **Example 21: Vague Offer vs Irresistible Offer:** Dimmed left column showing generic consulting vs bold right column showing guaranteed outcome.
- **Example 22: Traditional Content Creation vs AI Second Brain:** Manual blank-page struggle vs automated voice-matched drafting.
- **Example 23: The Creator Sweet Spot (3-Circle Venn):** What you know, what they need, and what you enjoy doing.
- **Example 24: Cheap Growth Tactics vs Sustainable Authority:** Buying engagement pods vs commenting on target buyer posts daily.
- **Example 25: ChatGPT vs GrowthMaster Comparison:** Flat robotic text vs multimodal LinkedIn operating system.

About the Author
GrowthMaster Research Team — Content Strategy & Analytics
Analyzing engagement metrics, viral visual formats, and algorithmic ranking signals across half a million LinkedIn posts.
Frequently Asked Questions
All 25 of these archetype designs are available as live, editable templates inside the free GrowthMaster LinkedIn Infographic Maker.